Market Commentary
Q4 2018
REVIEW OF 2018 PORTFOIO CHANGES
Throughout 2018, we enacted several portfolio changes intended to reduce portfolio risk given our cautious investment outlook then and into 2019. Changes in the Fixed Income portfolio were designed to improve quality and reduce exposure to corporate debt. The result of each portfolio change proved to add value. Credit strategies (EM Debt, High Yield and Bank Loans) experienced sell-offs late in the year, which we avoided. Proceeds were invested in high quality bonds that experienced positive returns during the period, as investors sought safety and quality from recession fears.
May – Sold Emerging Market Debt Strategy
- EM Debt yields versus US Treasuries hit a 10-year low, making risk/return unattractive after strong holding period returns.
- US Dollar appreciation due to rate increases creates stress on emerging markets economies and company’s ability to make interest payments.
- Non-US economies began to slow meaningfully early in the year resulting in credit quality concerns for EM Debt issuers.
August – Swapped Managed Futures Strategies
- Original strategy had more long exposure to equities than desired, particularly in sell-offs, reducing diversification benefits.
- New strategy performed well through the Q4 market correction (up 4.2% while stocks down -19%), providing intended negative correlation to stocks during a sell-off.
November – Sold High Yield and Bank Loan Strategies
- High Yield spreads declined to a 10-year low making returns unattractive relative to the risk of default. Since the sale, prices have declined as investors have worried about a slowdown in growth that could lead to higher defaults.
- Bank Loans’ floating coupons and zero duration were a benefit through the first 10 months of the year, but with tight spreads (low yields relative to safer assets) and decelerating fundamentals, the sector’s risk/reward became skewed to the downside.
November – Bought Securitized Credit and Floating Rate US Treasuries
- To increase the credit quality of the overall Fixed Income portfolio, we purchased Securitized Credit and Floating Rate US Treasury strategies.
- Securitized credit is made up primarily of high quality, investment grade mortgage and asset-backed securities. Our belief is that households are in much better financial shape than corporations at the end of this cycle. While household debt ratios have not increased, corporate debt has expanded significantly.
December – Sold Merger Arbitrage Strategy
- Non-correlated strategies like merger arbitrage performed very well in 2018.
- Our merger arbitrage strategy was the single best performing investment in our portfolio for 2018, up 6.5%, and a top decile performer in the liquid alternatives Morningstar category.
- Unfortunately, the lead portfolio manager, in whom we placed a high level of confidence, left the firm in December which led us to liquidate the investment. We are currently searching for a merger arbitrage strategy replacement, likely to be implemented in January.
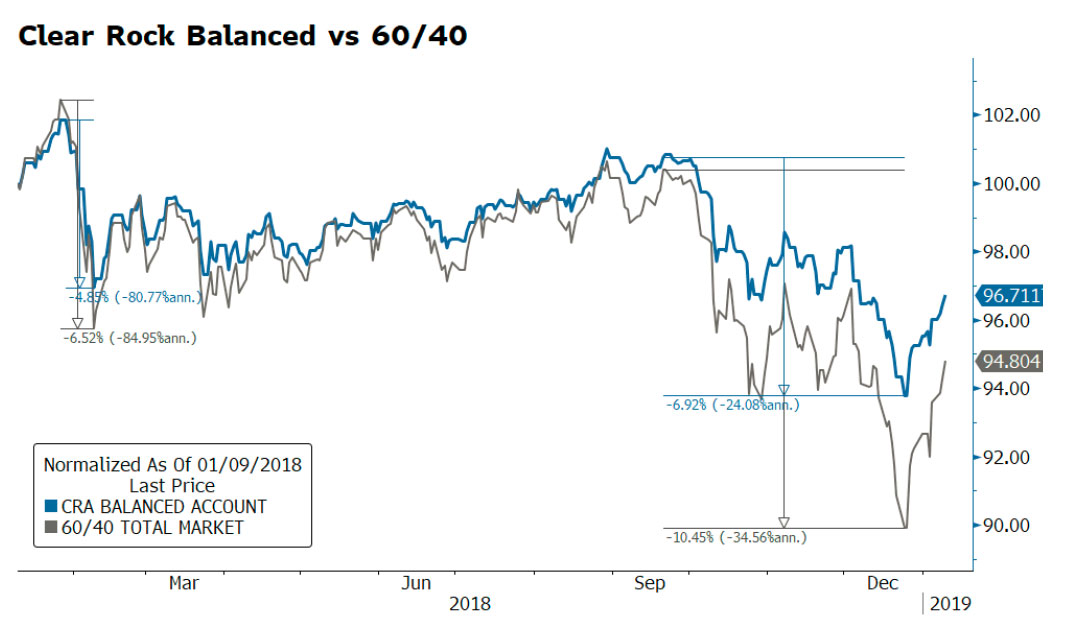
DIVERSIFICATION PAID OFF IN 2018
The importance of a more diversified portfolio was evident in 2018. The graph shown represents the Clear Rock Balanced Portfolio versus a 60/40 stock/bond portfolio, considered a standard “moderate” allocation for individual investors. As you can see, our model experienced far better relative performance (-6.92%) versus the 60/40 portfolio (-10.45%), particularly in the 4th quarter. Lower drawdowns translate to more stable returns and less risk.
OUTLOOK
Concerns of recession are rising as we enter the 10th year of economic expansion. Europe, Japan, and many emerging markets began to slow in early 2018 with the US and China joining the ranks in 2019. We believe that this year will be characterized by a downshift in growth, although not a halt, and that recession is not imminent this year.
However, monetary policy normalization, both here and abroad, is likely to cause more market volatility in 2019. Our long-term return expectations remain guarded as valuations compress from recent cycle highs and global risk-free rates rise from post-crisis lows.
Rates
The best indicator of the direction of interest rates is to understand the direction of inflation. Is inflation headed up due to higher economic activity and wage pressure, or is it headed down due to slowing growth and possible recession? Until recently, inflation was firmly headed higher, supporting the Fed’s rate hikes and QE reduction. Over the past few months, however, inflation has moderated, along with economic growth, putting pressure on the Fed to re-think their efforts to normalize monetary policy.
Long-term interest rates moved dramatically higher through most of 2018 but retreated at year-end as fears of a slowdown took hold. We believe the 10-year US Treasury yield is most likely near its low for 2019 at 2.65% and could easily return to the previous high of 3.25%, or higher, over the coming 12 months. While a decelerating economy argues that rates stay low, record debt issuance by the US Treasury due to budget deficit spending is likely to cause rates to firm and investors to demand more yield to absorb supply. The US Treasury market depends on steady demand from China and Japan which has waned at today’s low rates. US retail investors have picked up the slack temporarily, but higher rates longer term will be necessary to attract foreign investors to fund our expanding appetite for deficit spending. US deficit spending affords current and potential growth but at what price?
Economy
Looking back to 2017, we saw global synchronized growth with virtually all economies advancing. With strong continued growth, the US diverged in 2018 from most of the rest of the world, which began to falter. As we begin 2019, US growth is now also starting to slow given the pressures of higher interest rates, rising costs and lower foreign demand. This doesn’t necessarily indicate an imminent recession, but it does imply that growth has likely peaked for this cycle.
Given mixed economic signals, we expect the Fed to pause rate hikes which will provide near-term relief for stocks. A pause will also cause the US Dollar to weaken, thereby providing non-US stocks, particularly in emerging markets, relatively more potential to rebound. Europe and China have slowed meaningfully over the past few quarters. Sub-2% growth in Europe means any slowdown could easily render a recession. While Chinese growth is at a 20-year low, it is still expected to remain above 6% with help from new stimulus (both monetary and fiscal) introduced over the past few months. A trade deal between US and China would help both economies and is expected early this year.
Earnings
Earnings slowdowns are often accompanied by recessions, but not always. We expect to see lower earnings in 2019 due to higher operating costs for labor, materials, and financing. Moreover, we expect fewer stock buybacks and weaker demand from economies abroad. As previously mentioned, profit margins have an unfortunate habit of collapsing in recessions, making earnings an undependable valuation measure at the end of a cycle, so the reasonable P/E on the S&P 500 today based on projected earnings may be deceiving.
Valuations
Valuation multiples don’t expand when monetary policy is contracting, making growth in fundamentals the sole driver of good equity returns. Following last year’s historic tax cut coupled with strong business confidence, fundamentals looked their best in a decade. Concerning however was that this good news was being fully discounted in the prices, yet market valuations were still dangerously high, bringing back memories of the dot-com bubble. This concern gives further support to our strategic “Protect” allocation and the underweighting of high-risk investments in our portfolios.
After a significant equity correction in 2018, are stocks now cheap? Unfortunately, the answer is not clear. In the near-term, US stocks will likely rebound from recent lows while trading at 19.6 times trailing 12 months earnings. While this is down from 21.8 times earnings one year ago, it is still at the high end of the historical range. The price/sales on the S&P 500, a more stable valuation measure that we prefer, has declined 25% over the past year from 2.3 to 1.7, but is still well above its 30-year average. Non-US stocks also performed poorly in 2018 and trade at much more attractive valuation levels than US stocks, albeit with less optimism about fundamentals over the coming year.
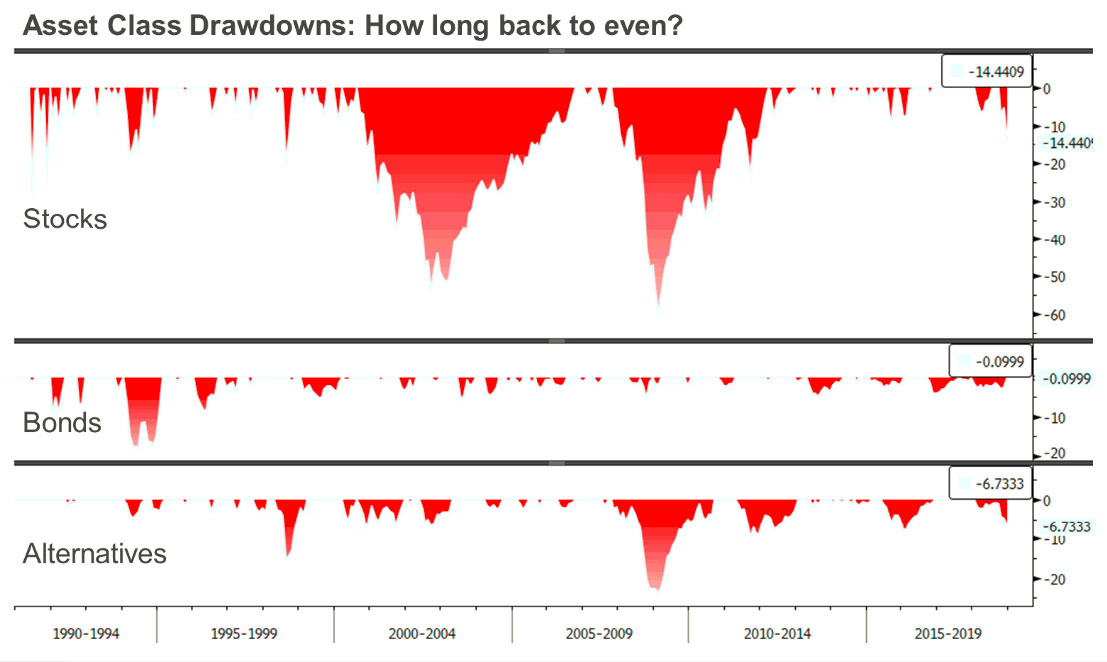
The chart shows asset class drawdowns for stocks, bonds and alternatives using widely cited benchmarks and includes the recent drawdown percentages. Two things of note: (1) the recent stock market sell-off looks small versus the two prior bear markets and (2) having a diversified portfolio including bonds and alternatives helped reduce portfolio downside.
Currencies
The US Dollar was exceptionally strong in 2018 due to interest rate and growth rate differentials versus the rest of the world. With interest rates in Europe and Japan still at or near zero, higher US rates (and growth) created more demand for US Dollars. We expect the recent lowering of long-term US rates and a pause by the Fed to increase rates to limit US Dollar strength, at least for the first half of the year. Emerging markets currencies have stabilized which will help support economic growth and better equity market performance in those countries.
CURRENT LONG-TERM STRATEGIC ALLOCATION
We continue our cautious investment outlook in 2019. Our client portfolios are currently in our most conservative PROTECT mode. As a reminder, we have three long-term strategic allocation modes: PROTECT, NORMAL, and CAPTURE. These allocations reflect forward-looking risk and return assumptions for each of the asset classes, but most importantly, stocks, which carry the highest risk. We monitor multiple factors to determine these allocation modes and apply them across all client investment objectives. Important inputs are equity valuations (P/E, P/S, etc.) and market cycle indicators (debt, unemployment, confidence, spreads, etc.). We implement higher allocations to riskier assets when forward-looking returns are highest (CAPTURE) while applying lower allocations when expected returns are lowest (PROTECT).
The table below considers historical stock market returns from 5 different valuation starting points. Generally, 60% of the time markets price stocks in a range we consider normal where neither a threat nor an abnormal opportunity exists (Quintiles 2-4 in gray). This typically results in average returns over 10 years and argues for a NORMAL strategic allocation to stocks. During these periods, our strategic weight to stocks is at the midpoint of each client investment objective allocation.
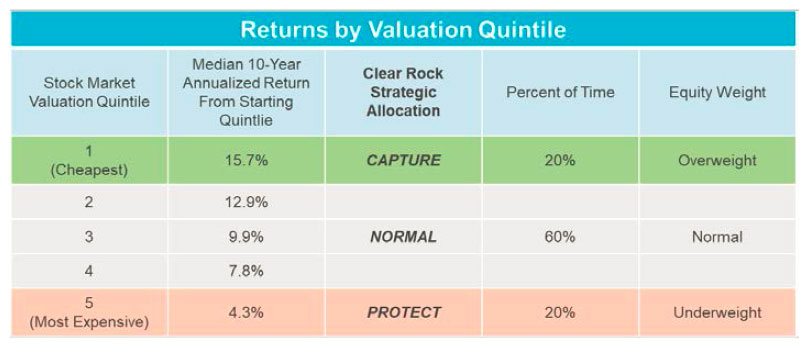
The remaining 40% of the time, markets price stocks either too expensively or too cheaply and an investor’s allocation to stocks during these periods have an impact on performance. Historically, stock market returns over 10 years following the period the market is at the cheapest 20% of its historical range (Quintile 1 in green) have averaged 15.7% per year. During these periods, we overweight equities.
Conversely, subsequent 10-year returns following the period stocks trade at their most expensive 20% of historical market valuations (Quintile 5 in red) have only averaged 4.3% returns. During these periods, we underweight equities.
Today, stock market valuations and cycle risks continue to keep us in PROTECT mode, characterized by an underweight to stocks and an overweight to Fixed Income and Alternatives, providing maximum diversification and minimized portfolio drawdowns. While the recent sell-off in stocks has somewhat lessened valuation risk, market cycle risk remains elevated.
The catalyst for a move to NORMAL would be predicated on continued strong fundamentals (higher corporate revenues and earnings), lower valuations (closer to the long-term historical average), and indications that economic growth is sustainable and re-accelerating, none of which present a compelling enough case to make that change today.
2018 Performance
Stocks
- Stocks globally were down (↓10.1%) with weakness led by International Small Cap (↓18.6%), Emerging Markets (↓14.6%), International Developed (↓13.3%), US Small Cap (↓11.8%), US Mid Cap (↓8.8%), and US Large Cap (↓4.6%). The difference between US and Non-US equity performance was primarily attributable to the rising US Dollar and corresponding weakness in foreign currencies.
- Looking ahead, US earnings need to be strong in order to provide support for stocks. Non-US stocks appear to have more upside given lower valuations, prospects of US Dollar weakness and reduced trade war fears.on-US stocks continue to be hurt by trade war fears.
Bonds
- After a tough first 11 months, total returns for Taxable bonds (↑0.30%) and Municipal bonds (↑1.07%) ended the year up slightly after rallying at year-end as interest rates fell sharply. Low credit quality sectors such as High Yield (↓3.4%) and Floating Rate Bank Loans (↑0.40) rallied most of the year but then fell sharply in the 4th quarter as fear of recession caused spreads to widen. Securitized Credit (↑2.59%) and ultra-short US Floating Rate Treasuries (↑1.72%) performed very well late in the year as investors moved out of higher risk bonds into higher credit quality sectors.
- Looking forward, rates have dropped as market fears of recession have increased. However, higher interest rates are likely in the cards as central banks around the globe continue to remove stimulus by raising short term rates and reducing holdings in their bond portfolios (unwinding QE).
Alternatives
- The Alternatives portfolio returned negative overall performance for the year (↓5.50%), half of the downside of stocks, but still disappointing. Hurting performance was the non-US equity exposure in the Hedged Equity category (↓11.8%), Market Neutral (↓1.1%), Managed Futures (↓3.7%) and Multi Strategy (↓2.1%).
- In the 4th quarter, however, Managed Futures (↑4.26%) and Market Neutral (↑1.54%) provided diversification and downside protection during that quarter’s equity market correction.
![]()
Royce W. Medlin, CFA, CAIA
Chief Investment Officer